Plot Gallery
BatteryProc generates a consistent set of publication-quality plots for every processed file. This page shows each plot type with a description of what it tells you about your cell.
All plots use a centralized style system (batteryproc.colours) for consistent colors, fonts, and layout. PNGs are saved at 300 DPI by default (adjustable with --dpi). Add --svg for vector graphics.
Default Plots
These plots are generated by default for fully processed files with sufficient cycle data. Very new or incomplete files may only produce a subset (for example, only the first-cycle overview).
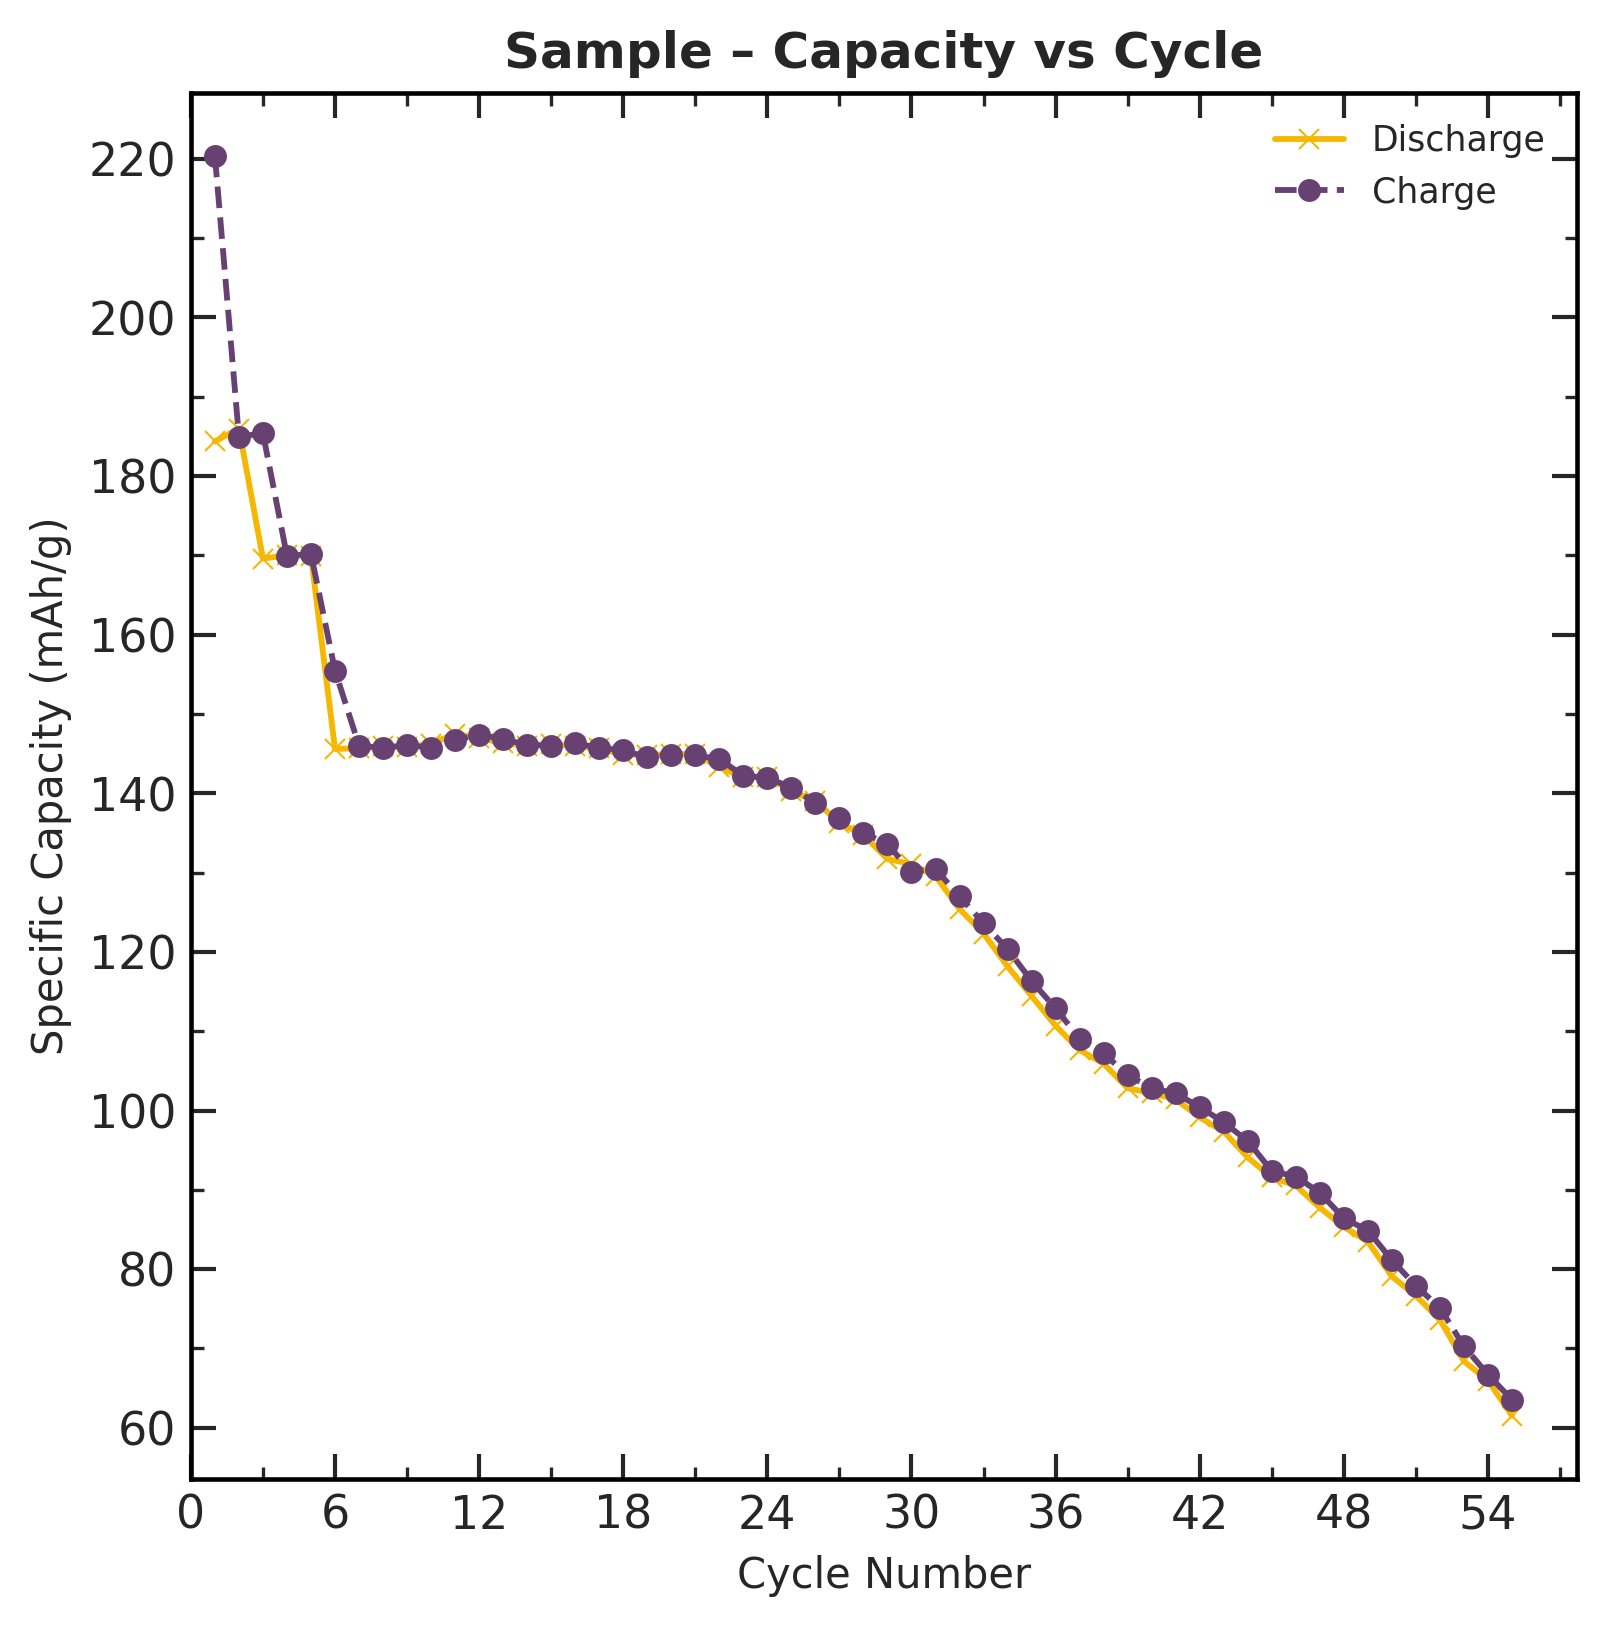
Capacity vs. Cycle
Shows the charge and discharge specific capacity (mAh/g) at each cycle. This is the primary performance metric for a battery cell.
What to look for: The slope of the discharge curve indicates the rate of capacity fade. A steeper decline means the cell is degrading faster.
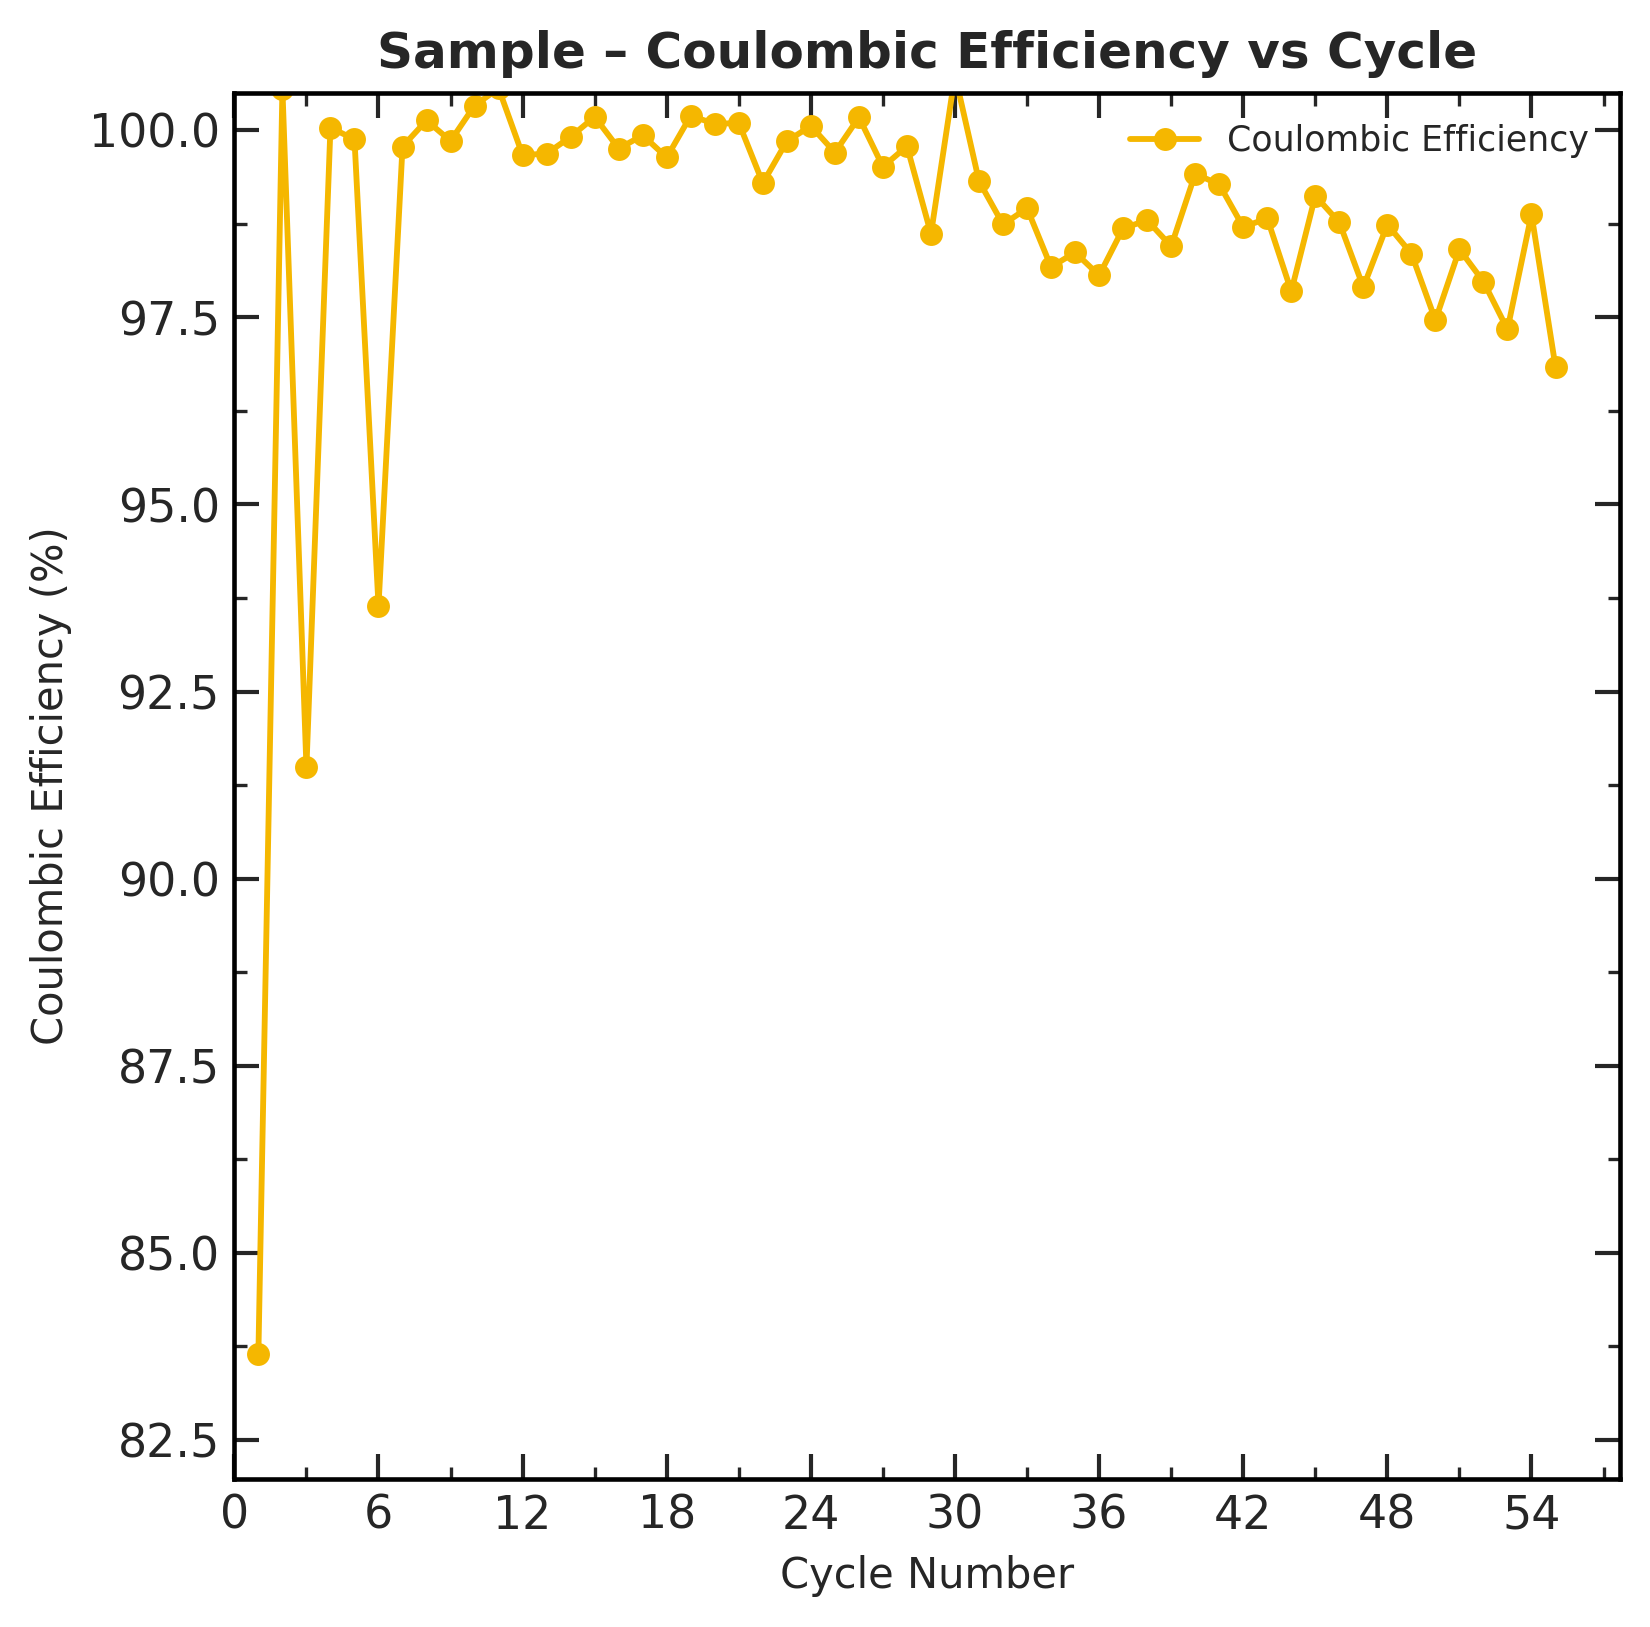
Coulombic Efficiency vs. Cycle
The ratio of discharge capacity to charge capacity for each cycle. A well-behaved cell should show CE near 99–100% after the first few formation cycles.
What to look for: Dips or scatter in CE indicate side reactions, electrolyte consumption, or measurement artifacts. Low CE in the first 1–3 cycles is normal (formation).
Capacity Retention vs. Cycle
Discharge capacity at each cycle normalized to Cycle 1 (= 100%). This provides a direct view of how much capacity has been lost over the cell's lifetime.
What to look for: Identify when the cell crosses key thresholds (e.g., 80% retention is a common end-of-life criterion).

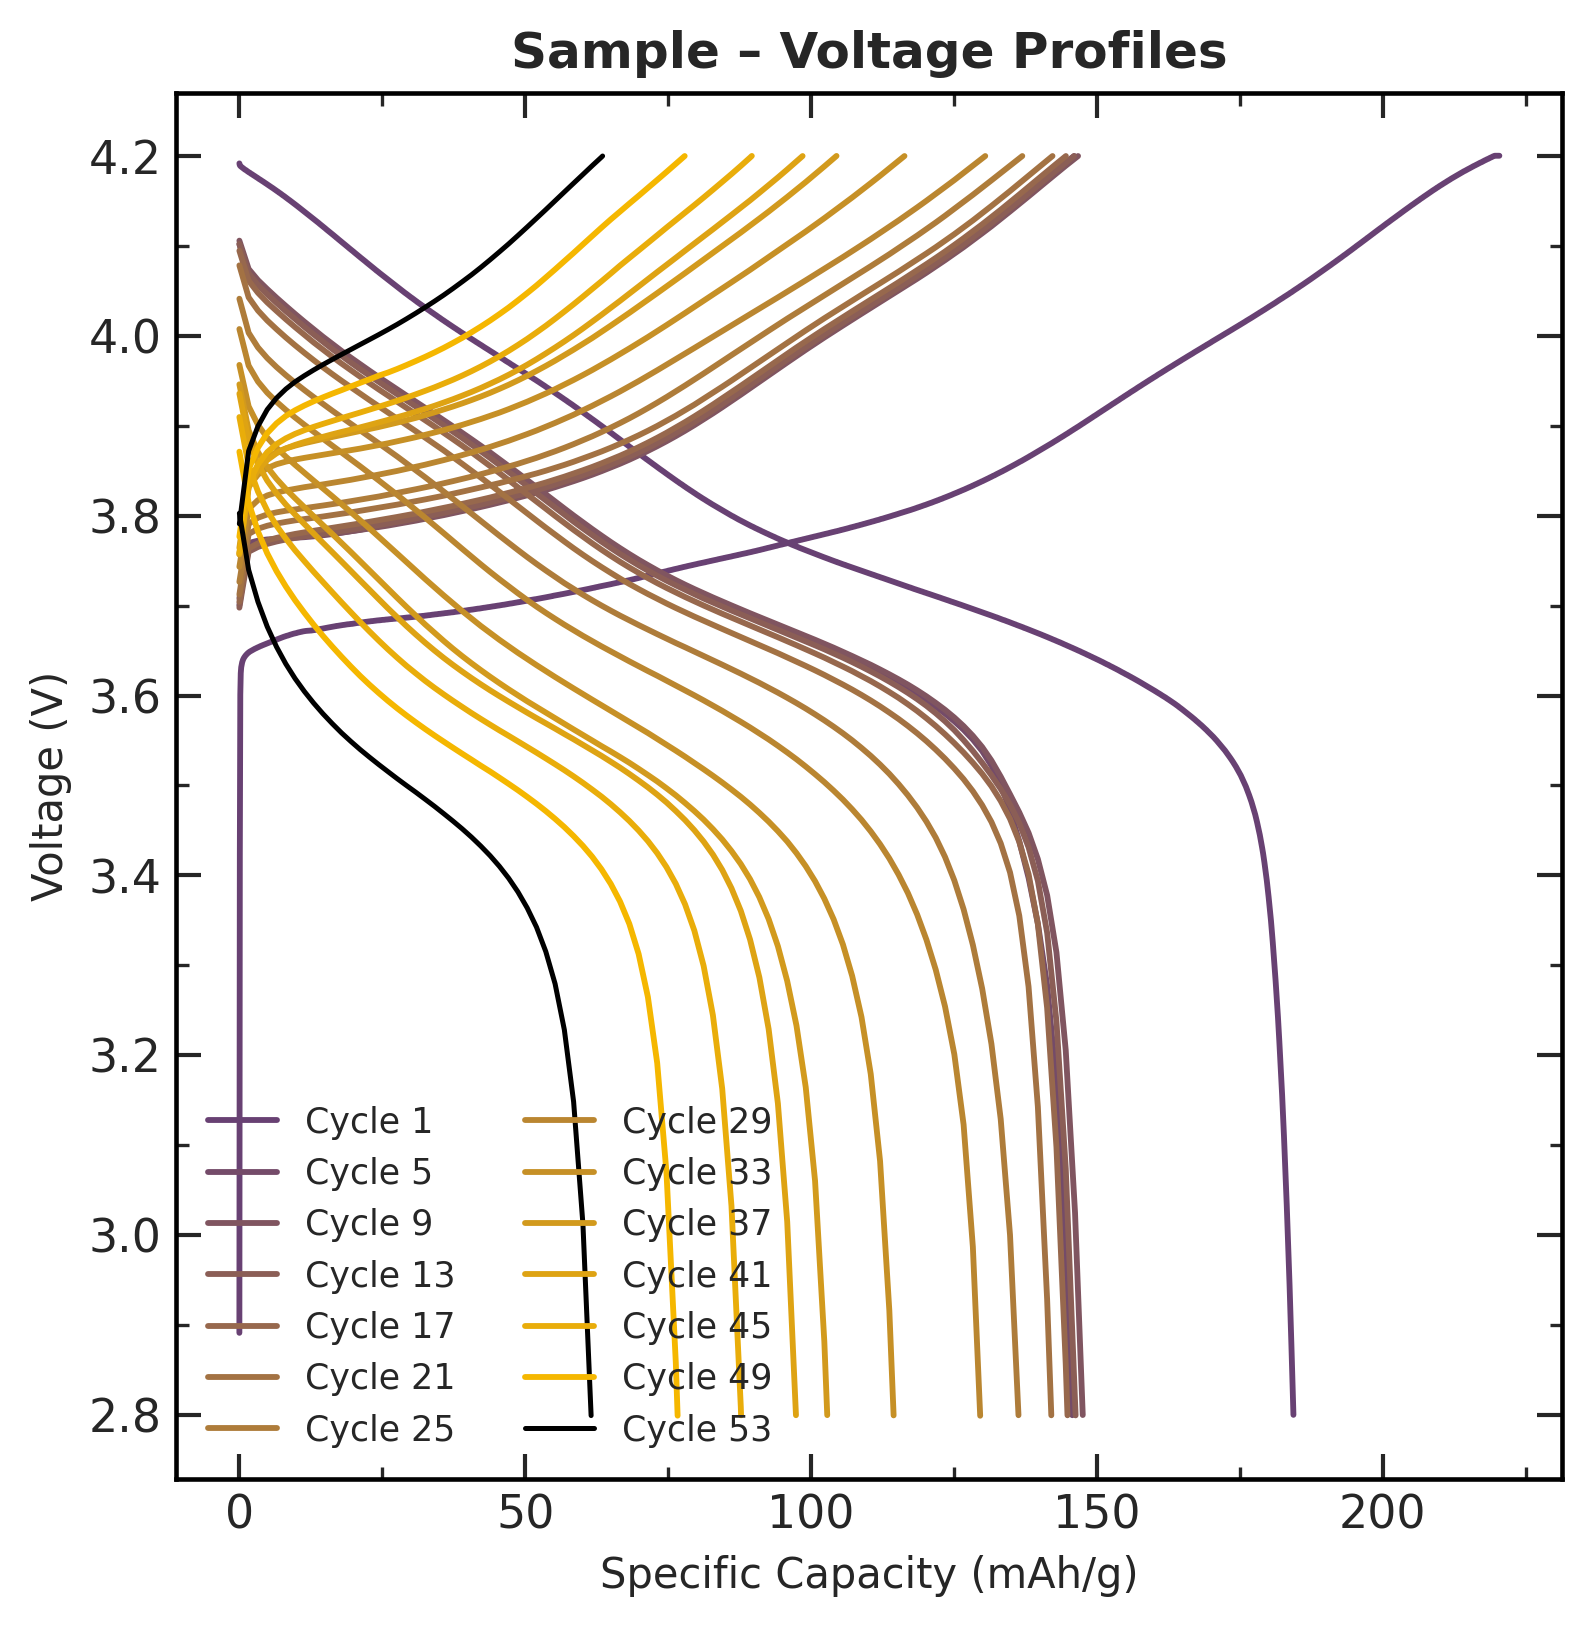
Capacity vs. Voltage (Voltage Profiles)
Voltage curves for charge and discharge at selected cycles. These curves reveal the electrochemical behaviour of the cell at different states of charge.
What to look for: Shifts in the curves over cycling indicate internal resistance growth, loss of active material, or changes in the electrode structure.
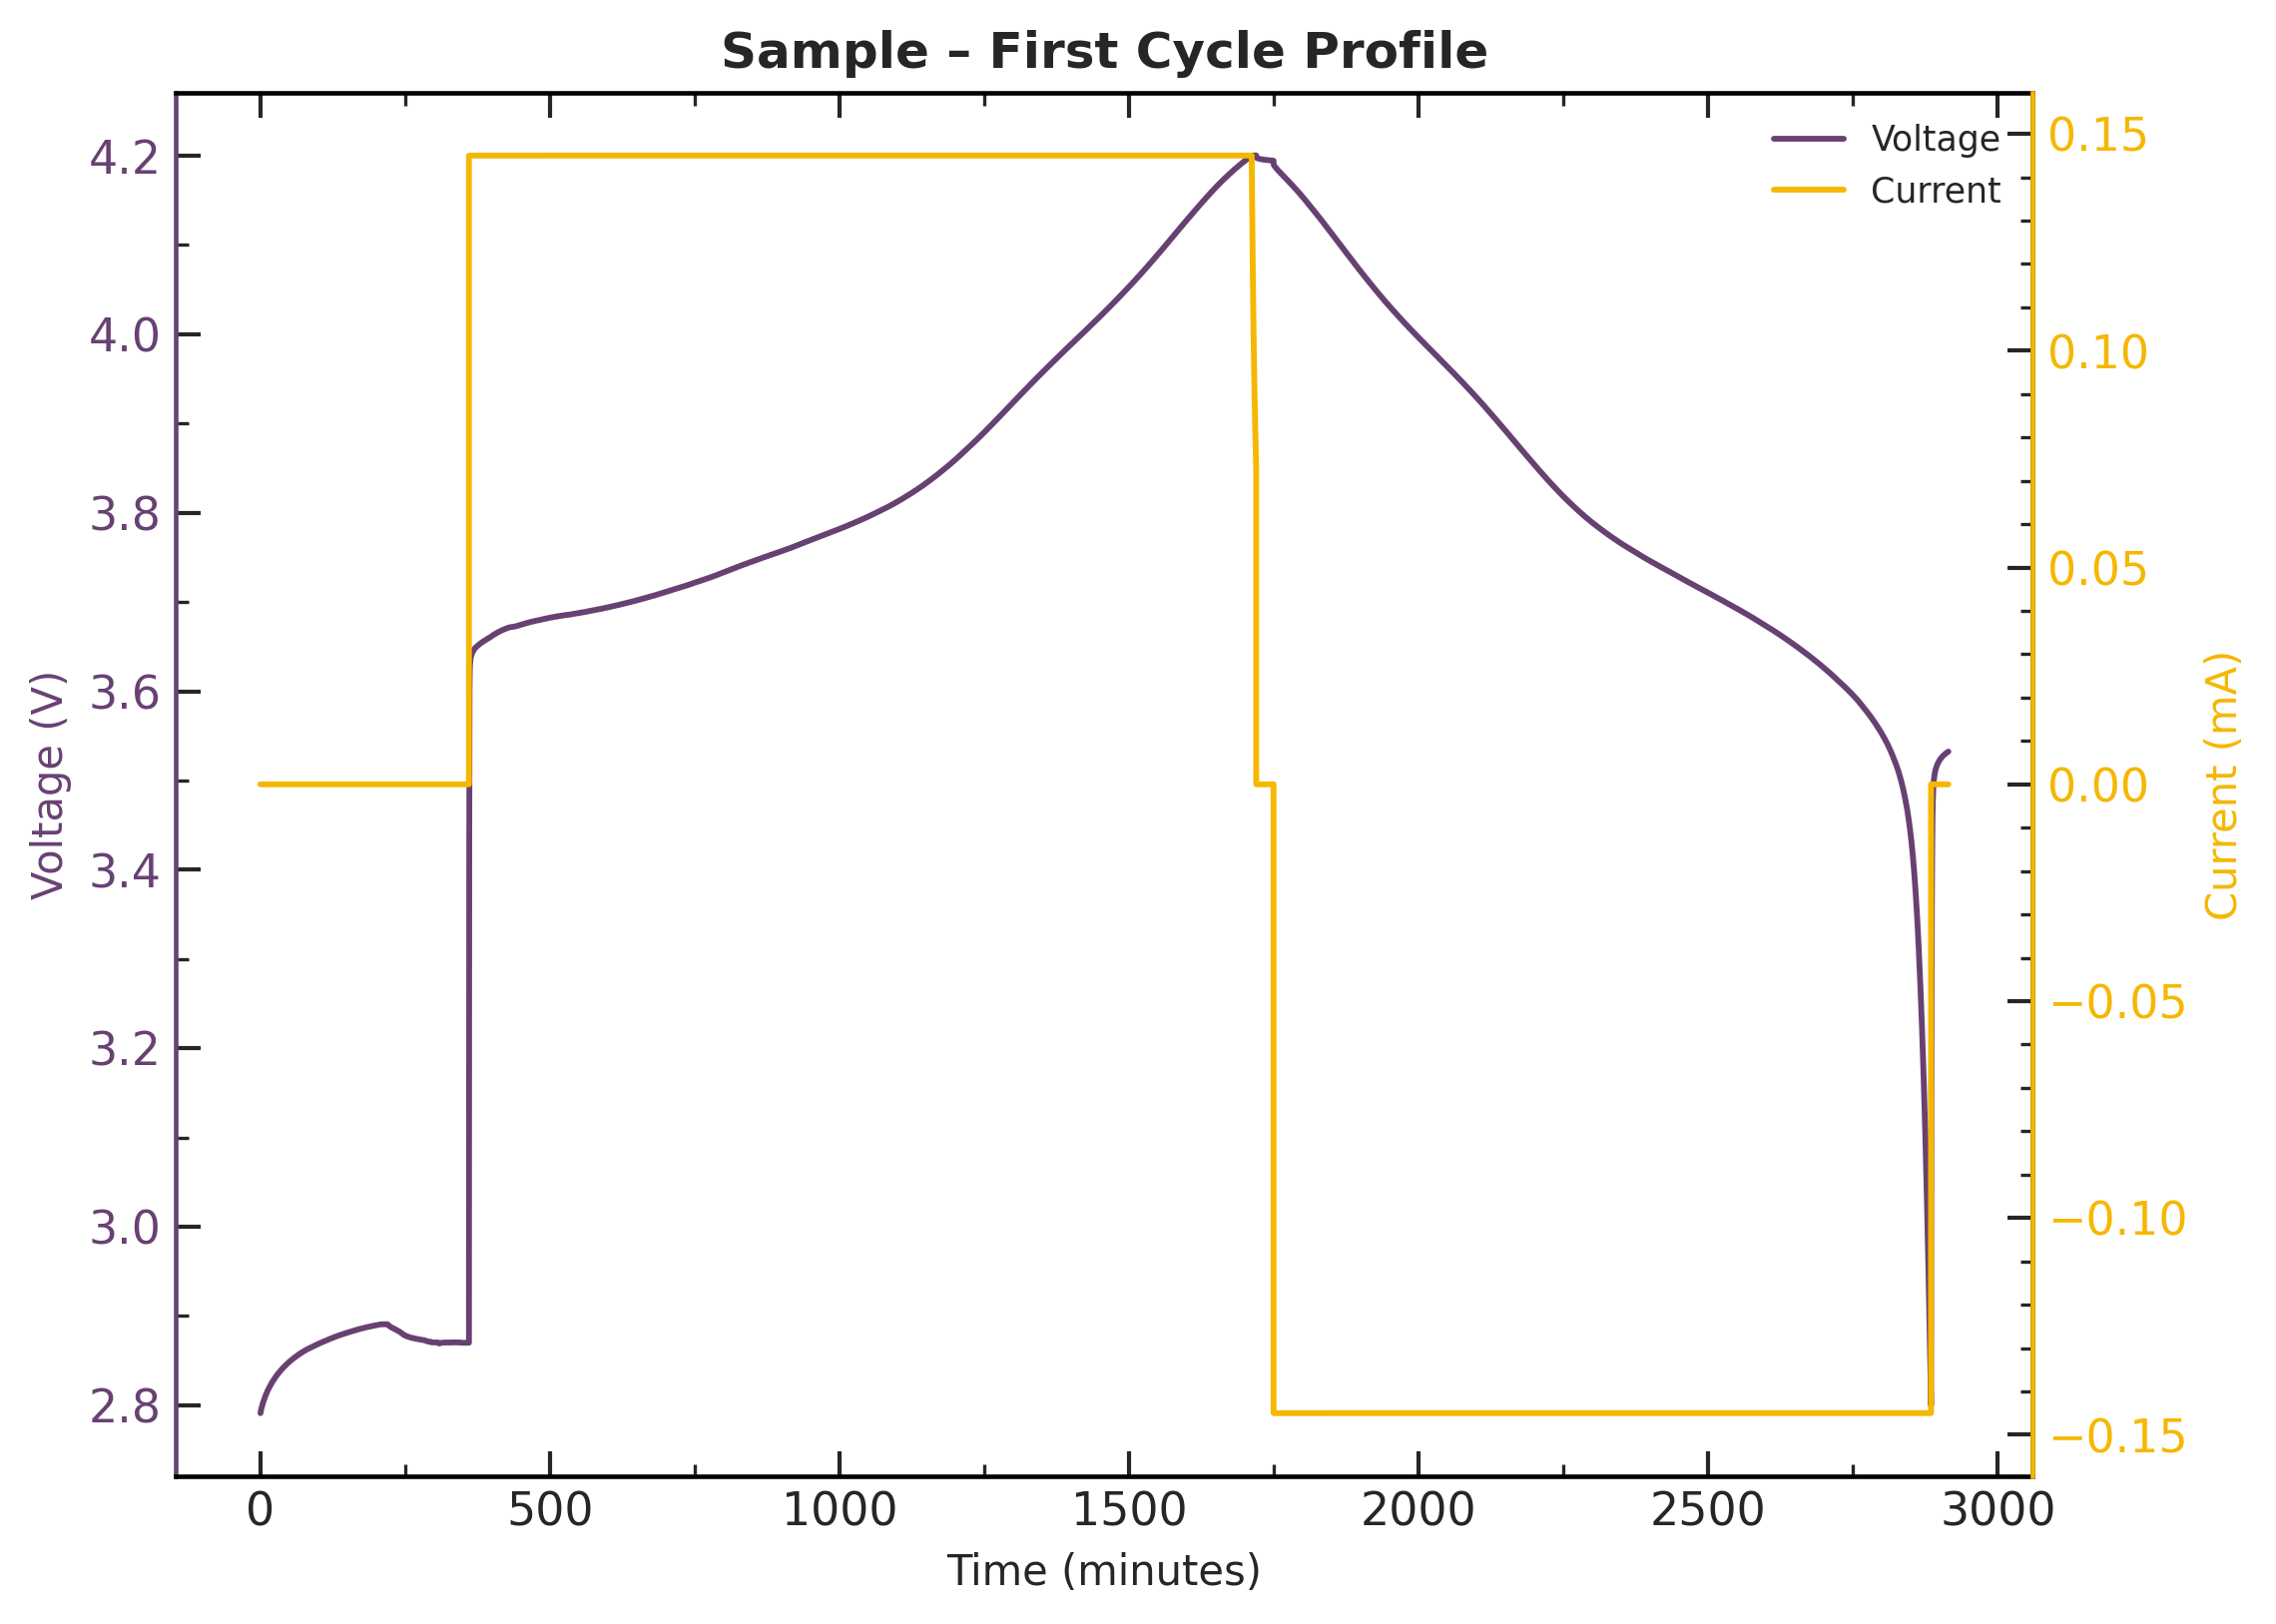
First Cycle Overview
A detailed view of voltage and current during the first cycle. Useful for verifying that the test protocol ran correctly and the cell behaved as expected.
Optional Plots
These plots are generated when the corresponding flag is provided.
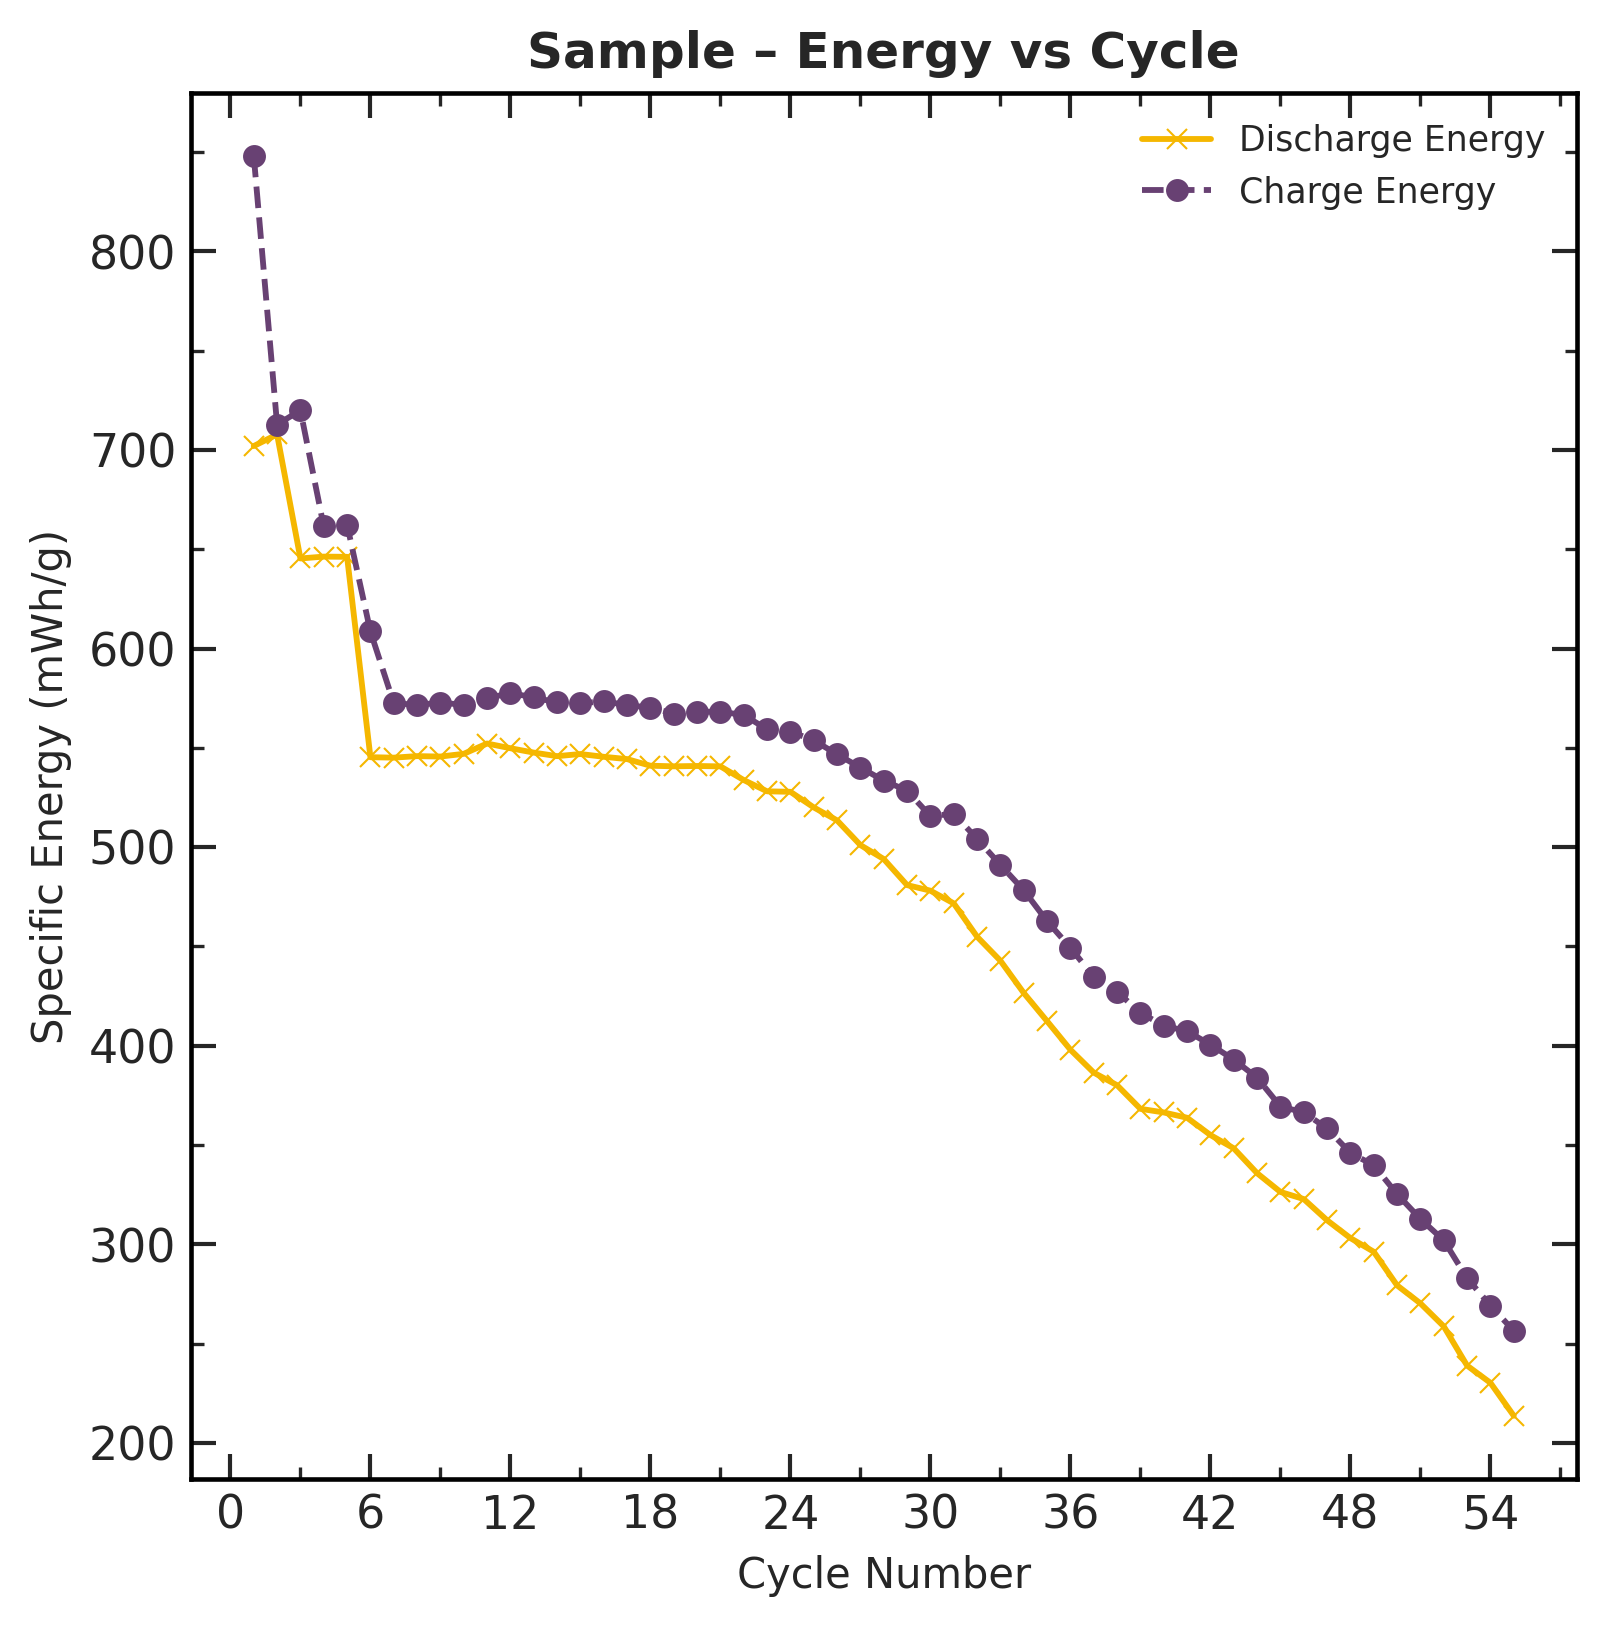
Energy vs. Cycle
Requires --energy flag.
Tracks specific energy (Wh/kg) for charge and discharge over the cell's cycle life. This metric is especially relevant for applications where gravimetric energy density matters (e.g., electric vehicles).
dQ/dV vs. Voltage
Requires --derivative flag.
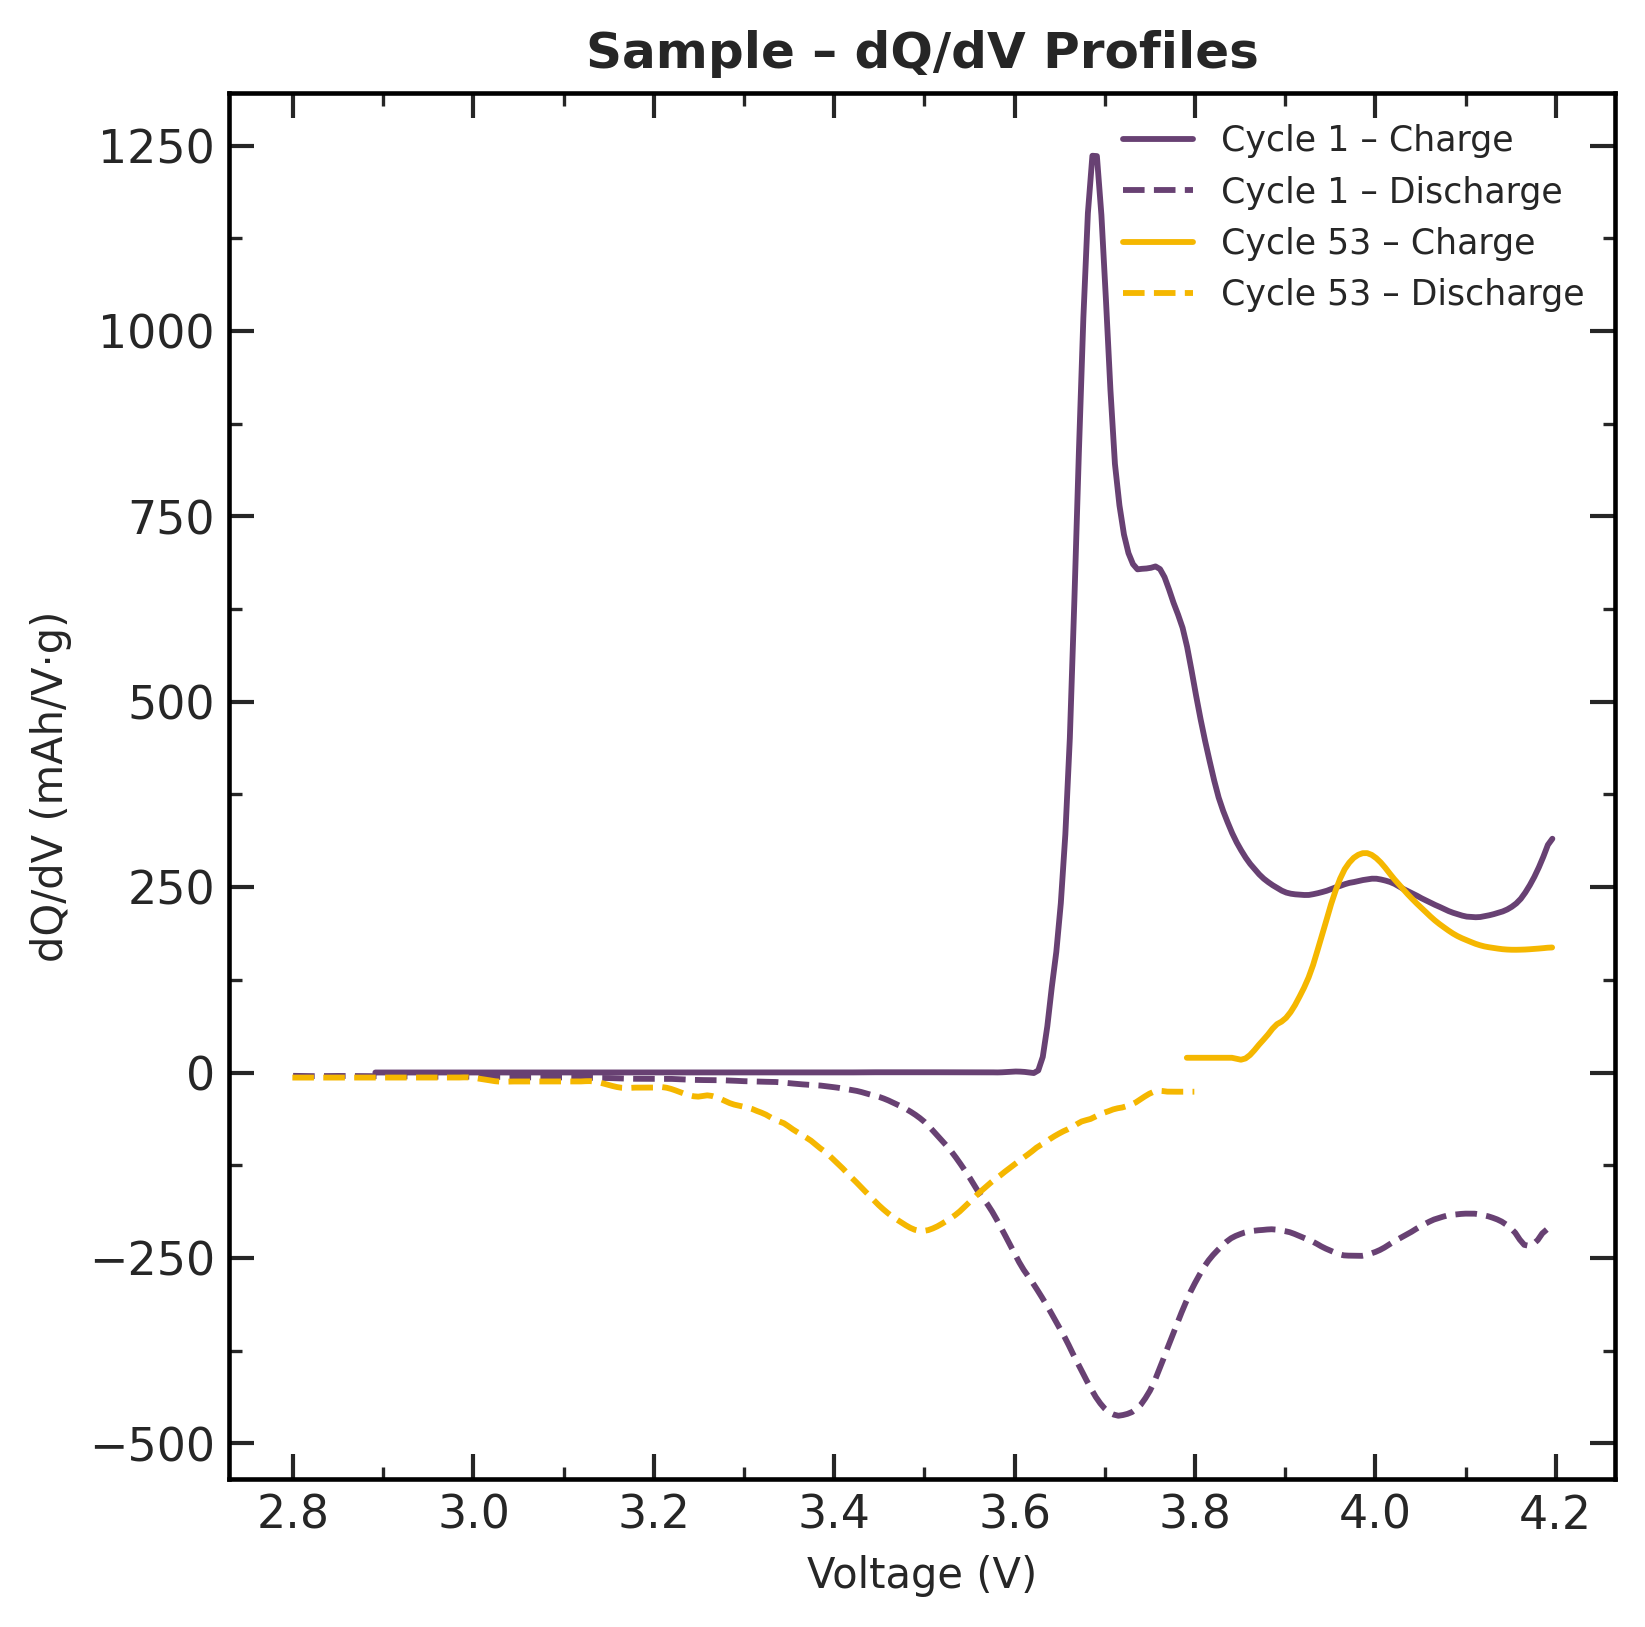
Differential capacity profiles showing dQ/dV as a function of voltage. Peaks in these curves correspond to phase transitions in the electrode materials.
What to look for: Peak shifts, broadening, or disappearance over cycling indicate specific degradation mechanisms (e.g., loss of lithium inventory, structural changes in the cathode).
Controlling Plot Output
| CLI Flag | Effect |
|---|---|
--svg |
Save SVG vector graphics in addition to PNG |
--dpi 600 |
Increase PNG resolution (default: 300) |
--energy |
Add energy vs. cycle plots |
--derivative |
Add dQ/dV plots (last cycle by default) |
--derivative 1 10 50 |
dQ/dV for specific cycles |
--csv |
Export the data behind each plot as CSV |
See the CLI Reference for the full list of flags.